Quick Answer
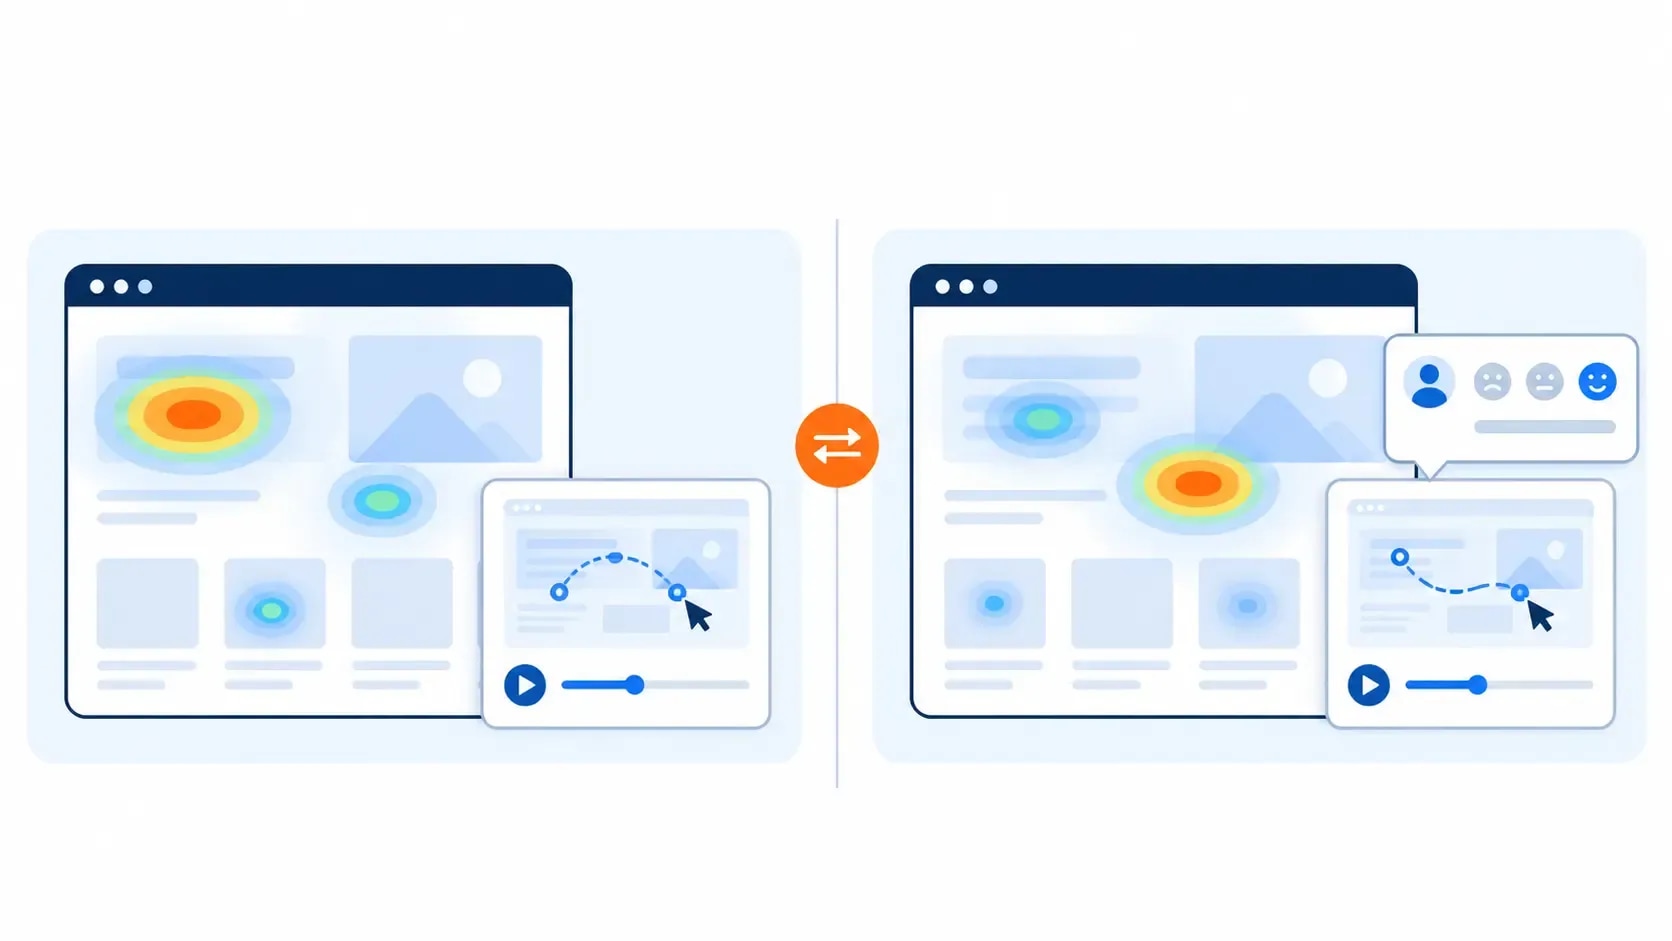
Microsoft Clarity is a free behavioural analytics tool that shows how people use a website through heatmaps, session recordings, filters and funnels. Install its tracking code once, check consent and masking, then investigate one specific page and question at a time. Pair it with GA4 or Search Console to measure whether a change improved the outcome.
Table of ContentsOn this page
- What Microsoft Clarity does
- Microsoft Clarity pricing and limits
- How to set up Microsoft Clarity
- Set up consent and masking before anything else
- How to read Microsoft Clarity heatmaps
- How to use session recordings
- Use filters, segments and funnels to narrow the problem
- Microsoft Clarity AI Visibility: citations and bot activity
- Connect Clarity with GA4 and Search Console
- A Microsoft Clarity workflow for SEO and CRO
- Common mistakes
- Microsoft Clarity vs GA4 vs Hotjar
- A 30-minute Microsoft Clarity review
- The bottom line
- Frequently Asked Questions
- Sources and References
Key Takeaways
- Clarity is free with no paid tier; the practical limits are 100,000 recorded sessions per project per day and 100,000 page views per heatmap.
- Consent Mode is on by default for visitors from the EEA, UK and Switzerland, and Clarity waits for a valid consent signal before setting cookies.
- Use heatmaps to find a pattern and recordings to see the context; neither explains intent on its own.
- Recording playback is kept for 30 days; labelled or favourited sessions and heatmap data for 9 months.
- The AI Visibility dashboards show AI citations and AI bot requests, but a bot request is not a citation and a citation is not a ranking.
- Measure the result of every change in GA4 or another outcome-tracking system.
A page view tells you that someone arrived. Microsoft Clarity shows what happened next: where they clicked, how far they scrolled, which path they took and where the page became hard to use. The useful work starts after installation, when you turn those observations into changes you can defend and measure.
Clarity costs nothing, so the financial risk of trying it is close to zero. The analytical risk is real. A heatmap does not explain intent, and a recording does not prove that one design choice caused a conversion problem.
A good review starts with one important page and one question. Narrow the data with filters, inspect the pattern, watch recordings that fit it, and test one sensible change. GA4, Search Console or your ecommerce platform then shows whether the outcome moved.
Verification note. Every feature, limit and date below was checked against Microsoft's own Clarity documentation on 11 October 2026. Clarity adds features often, so follow the linked pages if your dashboard looks different.
What Microsoft Clarity does
Microsoft describes Clarity as a behavioural analytics tool for understanding how people interact with a website or app. Its core features are session recordings, heatmaps, filters and segments, funnels and smart events, and Copilot summaries and chat. It now also includes AI Visibility dashboards, ad campaign insights and a mobile SDK for app analytics [2].
That is a different job from traffic analytics. GA4 shows how visitors arrived, which events fired and whether a conversion happened. Search Console shows the queries and landing pages that earned Google impressions and clicks. Clarity adds the visual layer: did visitors reach the form, tap an image that is not a link, jump back and forth between sections, or give up after an error?
Questions Clarity answers well
- Do mobile visitors reach the main call to action?
- Are people tapping an image or label that looks clickable but is not?
- Where does attention fall away on a long article?
- Which step in a checkout or lead form shows the most friction?
- Do organic visitors behave differently from paid or referral traffic?
- What happened just before a JavaScript error or an abandoned step?
It is far less useful when the question is vague. Watching ten unrelated recordings produces ten interesting stories and no reliable priority.
What Clarity cannot tell you
Clarity does not measure Google rankings, backlinks or search demand. It cannot tell you why someone behaved a certain way without other evidence. A short visit could mean disappointment, or that the visitor found the answer at once. A dense cluster of clicks could mean interest, confusion or a broken element.
Use behaviour data to form a hypothesis. Then check it with an outcome metric, a user test, customer feedback or a controlled experiment.
Microsoft Clarity pricing and limits
Microsoft describes Clarity as "a free service forever", with no traffic limits that force an upgrade and no paid version [1]. There is no plan to choose and nothing to budget for.
Free does not mean unlimited in every technical sense. The documented limits are:
| Limit | Value |
|---|---|
| Recorded sessions | Up to 100,000 per project per day |
| Page views per heatmap | Up to 100,000 |
| Recording playback retention | 30 days |
| Labelled or favourited sessions | 9 months |
| Heatmap data | 9 months |
| Google Analytics properties linked | One web property per Clarity project |
Sources: Clarity FAQ, data retention and GA integration documentation [1] [11] [10].
Cost is also not the only question. Before installing any behavioural analytics tool, think about consent, who gets access, masking, retention, and whether the pages being recorded contain sensitive information.
How to set up Microsoft Clarity
Clarity supports manual installation, third-party platform integrations and an npm package. For a manual setup, each project has its own tracking code that goes in the site's head section. Supported platforms include WordPress, Shopify, Wix and Squarespace [3].
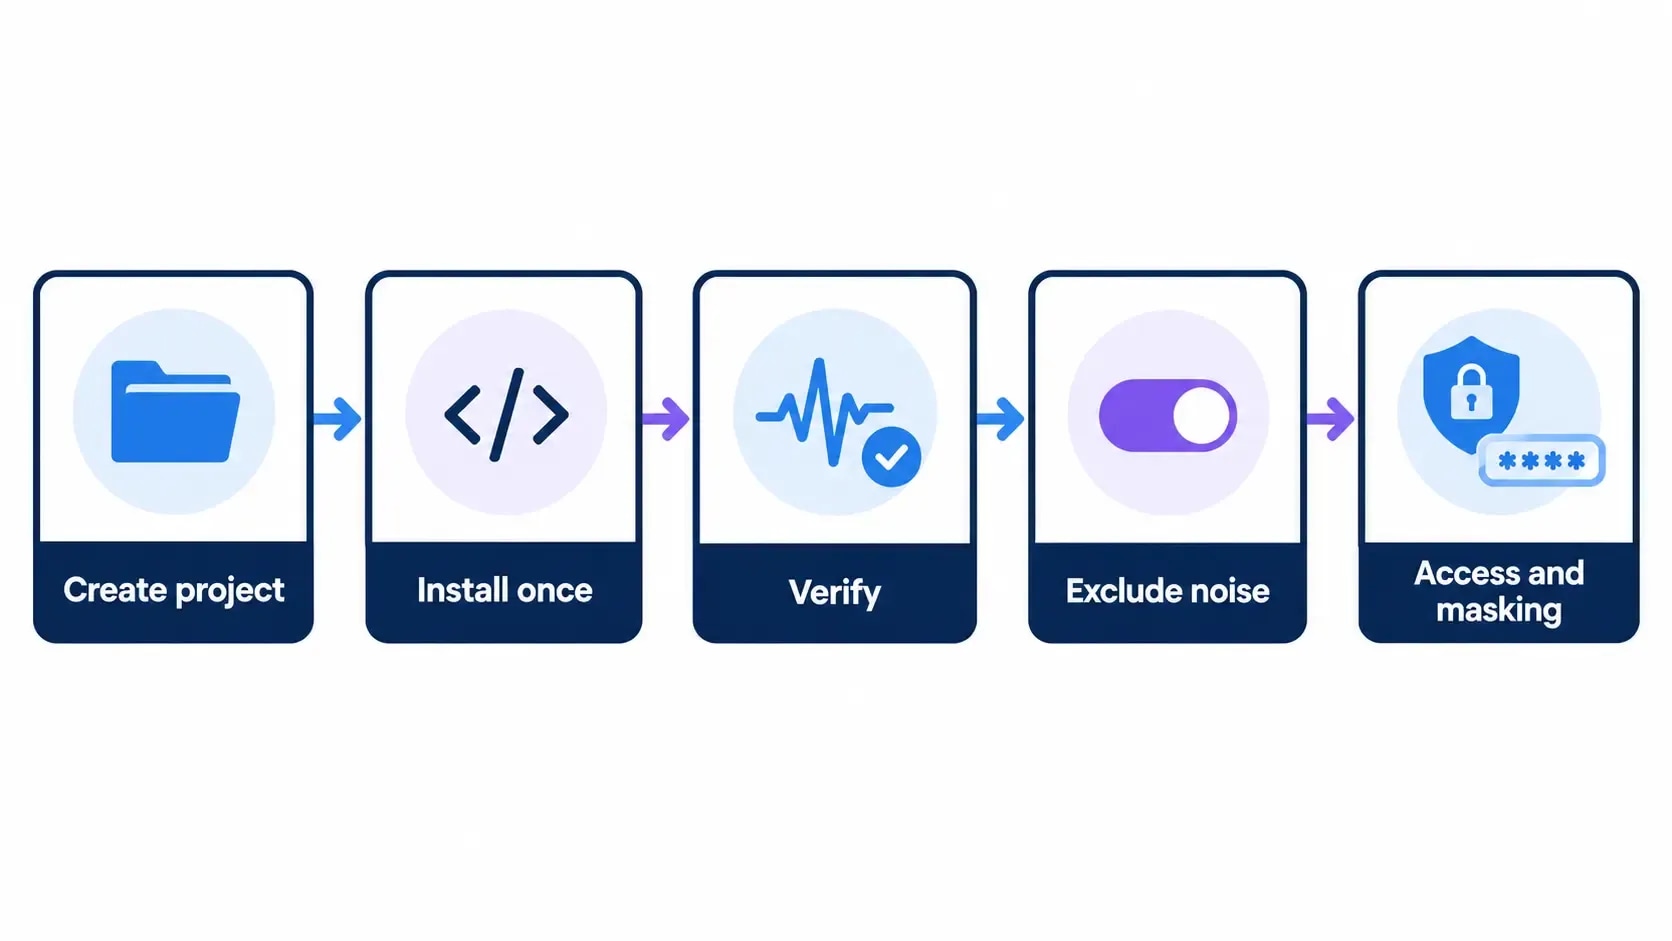
1. Create the project
Sign in to Clarity, create a project for the website and check the domain is correct. Use a separate project for each separate website when you need clean reporting and access control. One project script can cover the subdomains of a single site.
2. Choose one installation method
- Manual code: paste the project tracking code into the site's head.
- Google Tag Manager: add Clarity through the existing container and publish. If your team already manages analytics tags in GTM, keeping Clarity there makes it easier to audit.
- WordPress: install Microsoft's official Clarity plugin and connect the project. It has more than 200,000 active installations on WordPress.org.
- Shopify or another supported platform: follow Microsoft's current platform instructions rather than editing a theme from an old tutorial.
- npm: use the package and initialisation method documented for JavaScript applications.
Install the project once. Running the same tracking code through both a plugin and a tag manager makes verification and troubleshooting harder. If GTM is your route, the Google Tag Manager setup guide covers the container and publishing workflow.
3. Verify the installation
Seeing the code in a template is not enough. Microsoft documents two direct checks: look for live activity in the Clarity project, or open the browser's Network panel and confirm POST requests to clarity.ms/collect while you use the site [3].
Check several page types, not only the homepage. A tag can work on a standard page and still miss a checkout, a subdomain, a single-page app route or a newly deployed template.
4. Exclude avoidable noise
Filter or block internal traffic where it makes sense, and confirm bot detection is enabled if that fits your reporting plan. Write down every exclusion, so a later analyst understands why Clarity and another analytics tool show different totals.
5. Decide access and ownership
Give administrator access only to people who need to change project settings, masking or users. People who only review behaviour data do not need every permission. Decide who owns consent checks, who reviews recordings and where approved findings are logged.
Set up consent and masking before anything else
Behavioural analytics captures more context than a page view count. Treat privacy setup as part of installation, not a cleanup job for later.
Consent Mode
Since 31 October 2025, Microsoft has enforced consent signal requirements for visits from the European Economic Area, the United Kingdom and Switzerland [4]. Consent Mode is enabled by default for those visitors, and Clarity waits for a valid consent signal before setting any cookies. Site owners remain responsible for passing consent changes to Clarity.
You can send the signal through a supported consent management platform or Clarity's Consent API. The right legal basis and banner wording depend on your site, audience and jurisdiction. Clarity provides the controls; it does not replace legal review.
Test both paths after implementation. Decline analytics consent and confirm the expected cookies are not written. Then grant consent and check the result. Microsoft's documentation includes a browser console method for reviewing the consent state [4].
Content masking
Clarity masks sensitive content by default, including all input boxes and dropdown menus. The default masking mode is Balanced, which masks only sensitive content such as numbers and email addresses. Strict masks all page content, and Relaxed masks less. Masked content is never uploaded to Clarity [5].
Review real recordings yourself anyway. Add explicit masking for account details, personal information, order data or anything that should not leave the browser. Clarity supports CSS selector rules and the data-clarity-mask attribute. Masking changes only apply to new recordings, never to old ones [5].
Do not use Clarity on a website or app aimed at users under 18. Microsoft states this restriction in its overview and FAQ [2] [1].
How to read Microsoft Clarity heatmaps
A heatmap adds up interactions across many page views. It is good at showing where attention or action concentrates, but it strips out the sequence and intent you can see in a single session.
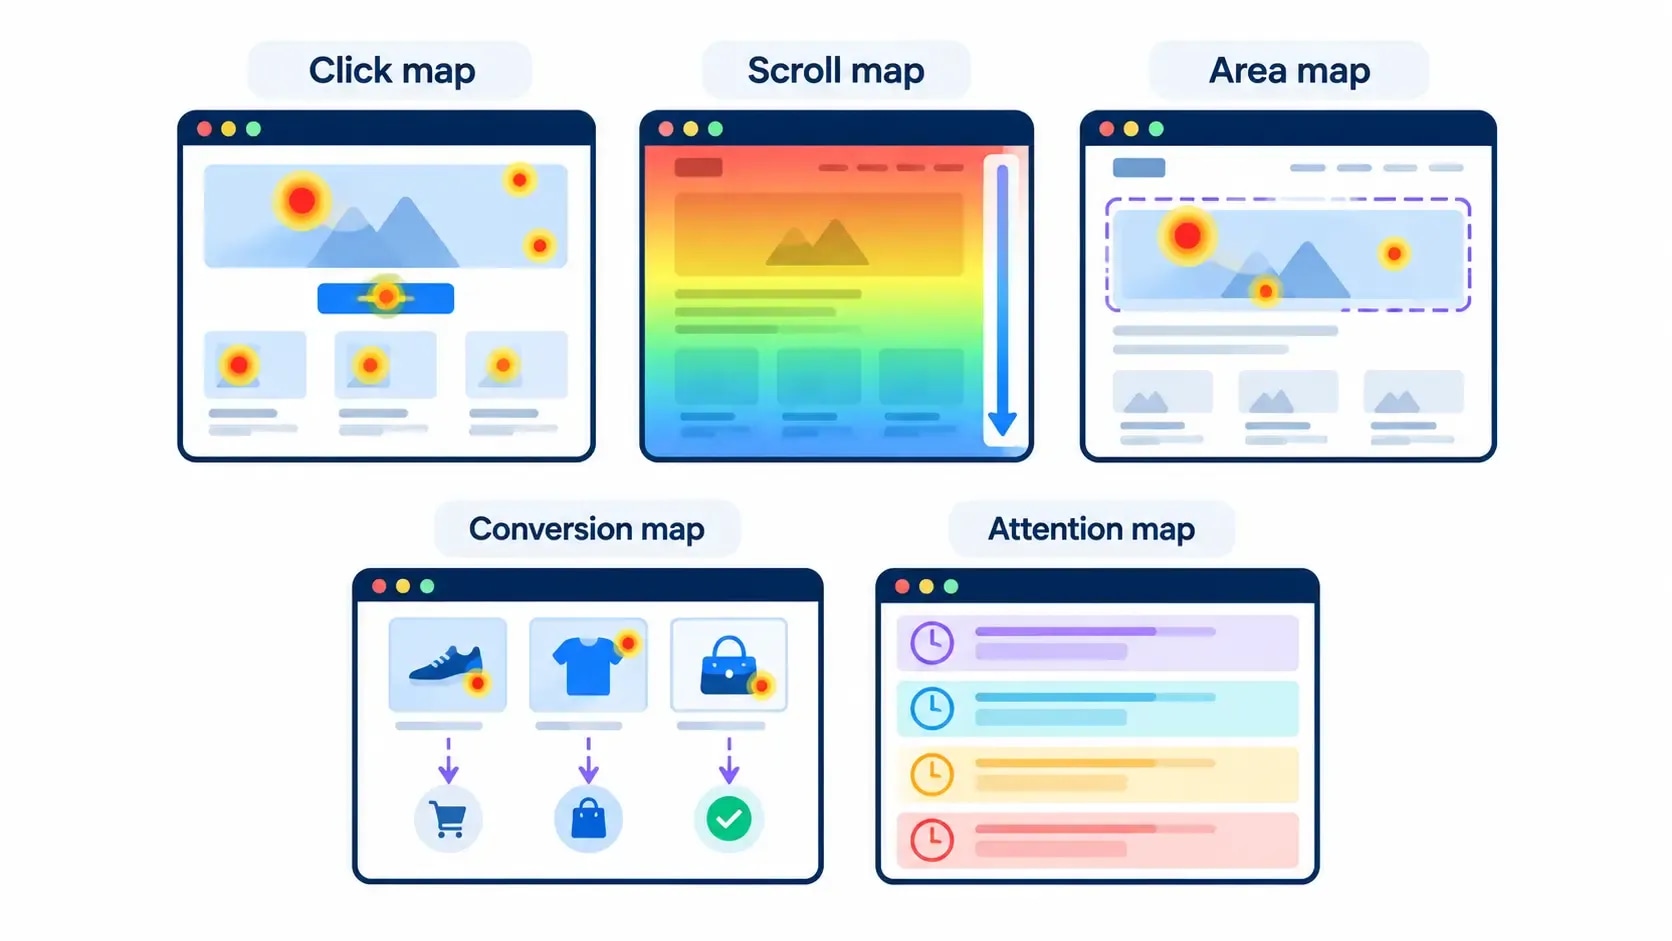
Clarity supports five heatmap types: click, scroll, area, conversion and attention maps [6]. Many older tutorials still describe only three. There is no minimum traffic needed to generate one.
Click maps
Click maps rank page elements by clicks, and offer views for all clicks, dead clicks, rage clicks, error clicks, first clicks and last clicks [6]. Look for:
- clicks on images, labels or decorative elements that do nothing
- primary buttons getting fewer clicks than a nearby secondary element
- mobile navigation items attracting repeated or error clicks
- first clicks that do not match the path the page intends
A high click count is not automatically good. Open matching recordings and see what happened before and after the click.
Scroll maps
Scroll maps show the share of visitors who reached each part of the page and mark the average fold [6]. Use them to check whether essential information sits above a large drop-off.
Someone who stops scrolling is not necessarily unhappy. An informational page may already have answered their question. A drop before the required action on a checkout or lead page is more worrying, so read the map against the page's purpose.
Area maps
Area maps total the clicks inside a section you select. They help when a component holds several links or controls and you want one figure for the whole block.
Conversion maps
On ecommerce sites, conversion maps connect clicks with purchases and order value, showing which elements attract attention and which are involved in completed sales [6]. Check that ecommerce events and product data are set up correctly before trusting them.
Attention maps
Attention maps estimate how long visitors spend on each section [6]. Time on a section is not the same as understanding it, so read them alongside scroll behaviour, recordings and the page's goal.
A better heatmap review sequence
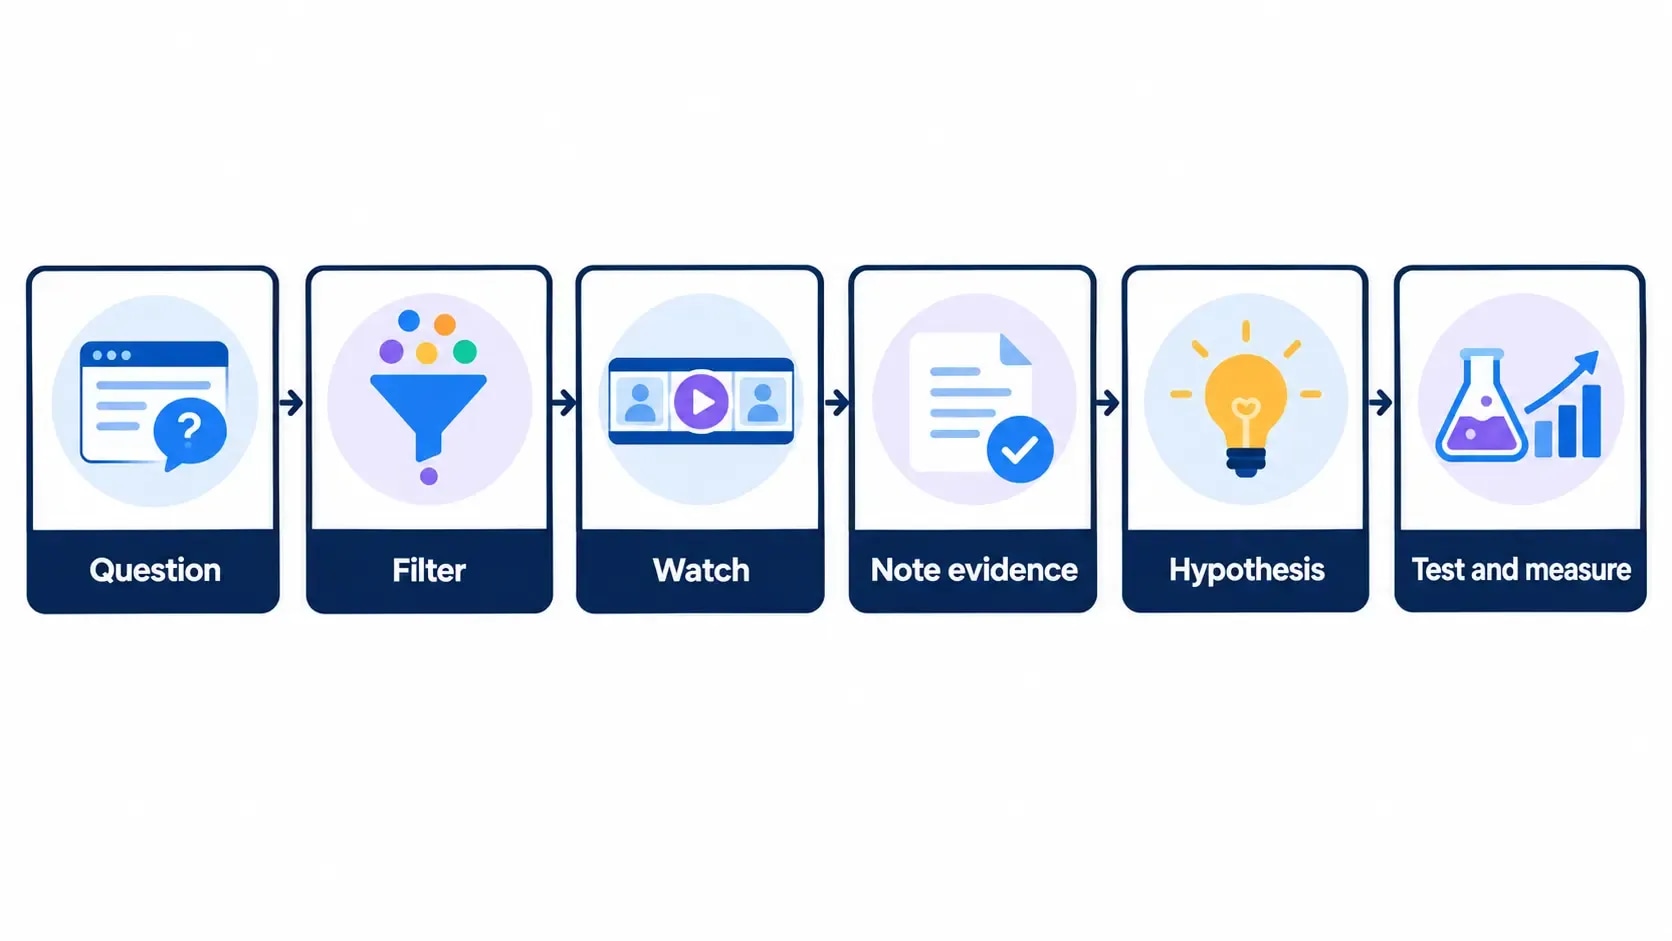
- Pick one important page or a tight group of similar URLs.
- Separate desktop and mobile.
- Apply a traffic source, country or audience filter when it matters.
- Look at scroll and attention patterns before individual clicks.
- Note one or two anomalies that affect the page's main task.
- Open recordings that match those anomalies.
- Write a testable explanation, not a design instruction.
For example: "Mobile visitors who reached the pricing section often tapped the plan heading, perhaps expecting it to expand." That observation points to a focused recording review. It does not yet justify rebuilding the pricing page.
How to use session recordings
Choosing the right recordings matters more than watching many of them. Microsoft Clarity recordings are reconstructions built from page information and user actions, not literal video of a visitor's screen [7]. That is why a replay can look slightly different from the live page, or miss content inside a third-party iframe or canvas.
Start from a question and a filter
Pick a concrete question:
- Why do mobile users abandon the contact form?
- What happens before a dead click on the product gallery?
- Do organic visitors reach the comparison table?
- Where do visitors go back to the previous page?
Filter to the relevant device, page, traffic source, behaviour or event, then watch a small, consistent set of sessions. How many you need depends on traffic and variation. No universal sample size makes every observation reliable.
Watch sequences, not single gestures
One rapid click means little alone. Look at what surrounds it: where the visitor entered, what was on screen, which element they tried first, whether the interface responded, and what they did next.
Label or favourite sessions that clearly support an issue. Use a behaviour label such as "mobile validation error" rather than anything that identifies a person.
Save evidence inside the retention window
Playback data is kept for 30 days; labelled or favourited sessions and heatmap data for 9 months. After that, data is deleted from Clarity's servers, including backups, and cannot be recovered [11]. Label what you need early, and do not promise a client that every historical recording will still exist.
Use filters, segments and funnels to narrow the problem
The fastest route to a useful finding in Microsoft Clarity is usually better segmentation, not more watching.
Clarity offers more than 30 filters, grouped across user information, actions, paths, traffic, performance, products, sessions, pages and custom data [8]. Useful ones include device, browser, location, entry and exit URL, UTM source, scroll depth, JavaScript errors, rage clicks, dead clicks, quick backs, smart events and funnels.
Segments worth saving
- Mobile visitors who entered on a key organic landing page.
- Paid campaign visitors who reached a form but did not submit it.
- Sessions with a JavaScript error after a click.
- Ecommerce visitors who viewed a product and started checkout.
- Returning readers who reached the main email signup.
Name segments so someone else can understand them, with the page, audience and behaviour in the name rather than "Segment 4".
Funnels are built in
Clarity builds funnels without code from page visits and smart events. Each funnel reports conversion rate, sessions converted and median time to convert, and every step links to filtered heatmaps and recordings [9].
That corrects a claim still common in older comparisons. You no longer need a separate paid tool to define a basic funnel. You may still prefer GA4 or a product analytics platform for attribution or deeper event analysis.
Microsoft Clarity AI Visibility: citations and bot activity
This is the newest part of Microsoft Clarity and the one most relevant if you care about AI search. It has two dashboards, and they measure different things.
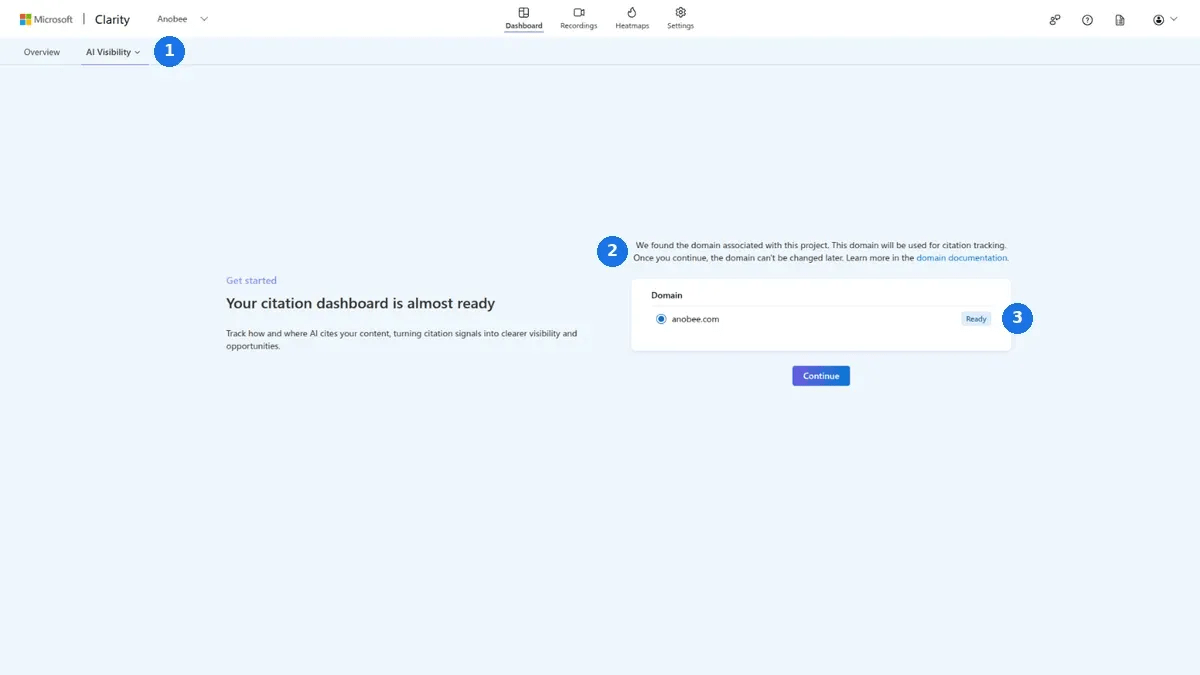
Citations shows how your content is referenced in AI-generated answers: which pages are cited, how often, the grouped query topics behind those citations, and a "share of authority" metric comparing your domain with competitors on the same queries [12]. Before the data appears, a project administrator verifies the domain through the Clarity tracking code, Google Search Console or Bing Webmaster Tools. Check the domain carefully at this step: the setup screen warns that once you continue, the domain used for citation tracking cannot be changed later. Microsoft is explicit that this dashboard does not measure traditional search rankings, impressions or click-through rates. Its documentation also does not list which AI assistants are covered, so treat it as one view of AI citation activity rather than a complete one.
Bot activity shows which AI systems and other verified bots request your site, how often, what share of requests come from AI bots, and which paths they hit most [13]. It is built from server-side logs through supported CDN and server integrations, not from the browser tracking code, so it needs that integration to work.
The caveat matters more than the feature. Microsoft states that a bot request does not mean content was retrieved, cited or surfaced in an AI answer, and may never turn into traffic [13]. A crawler visiting a page is the earliest signal in a long chain, not evidence of visibility. Use Bot activity to see who is crawling and how heavily, and Citations to see what is actually being referenced.
Connect Clarity with GA4 and Search Console
Clarity and GA4 answer different parts of the same investigation.
| Question | Best starting point |
|---|---|
| Which queries earned Google impressions and clicks? | Search Console |
| Which channels and campaigns sent sessions? | GA4 |
| Which events or conversions happened? | GA4 or an ecommerce platform |
| Where did visitors click or stop scrolling? | Clarity heatmaps |
| What sequence came before visible friction? | Clarity recordings |
| Did a page change improve outcomes? | GA4, experiment data or business records |
| Which pages are cited in AI answers? | Clarity AI Visibility |
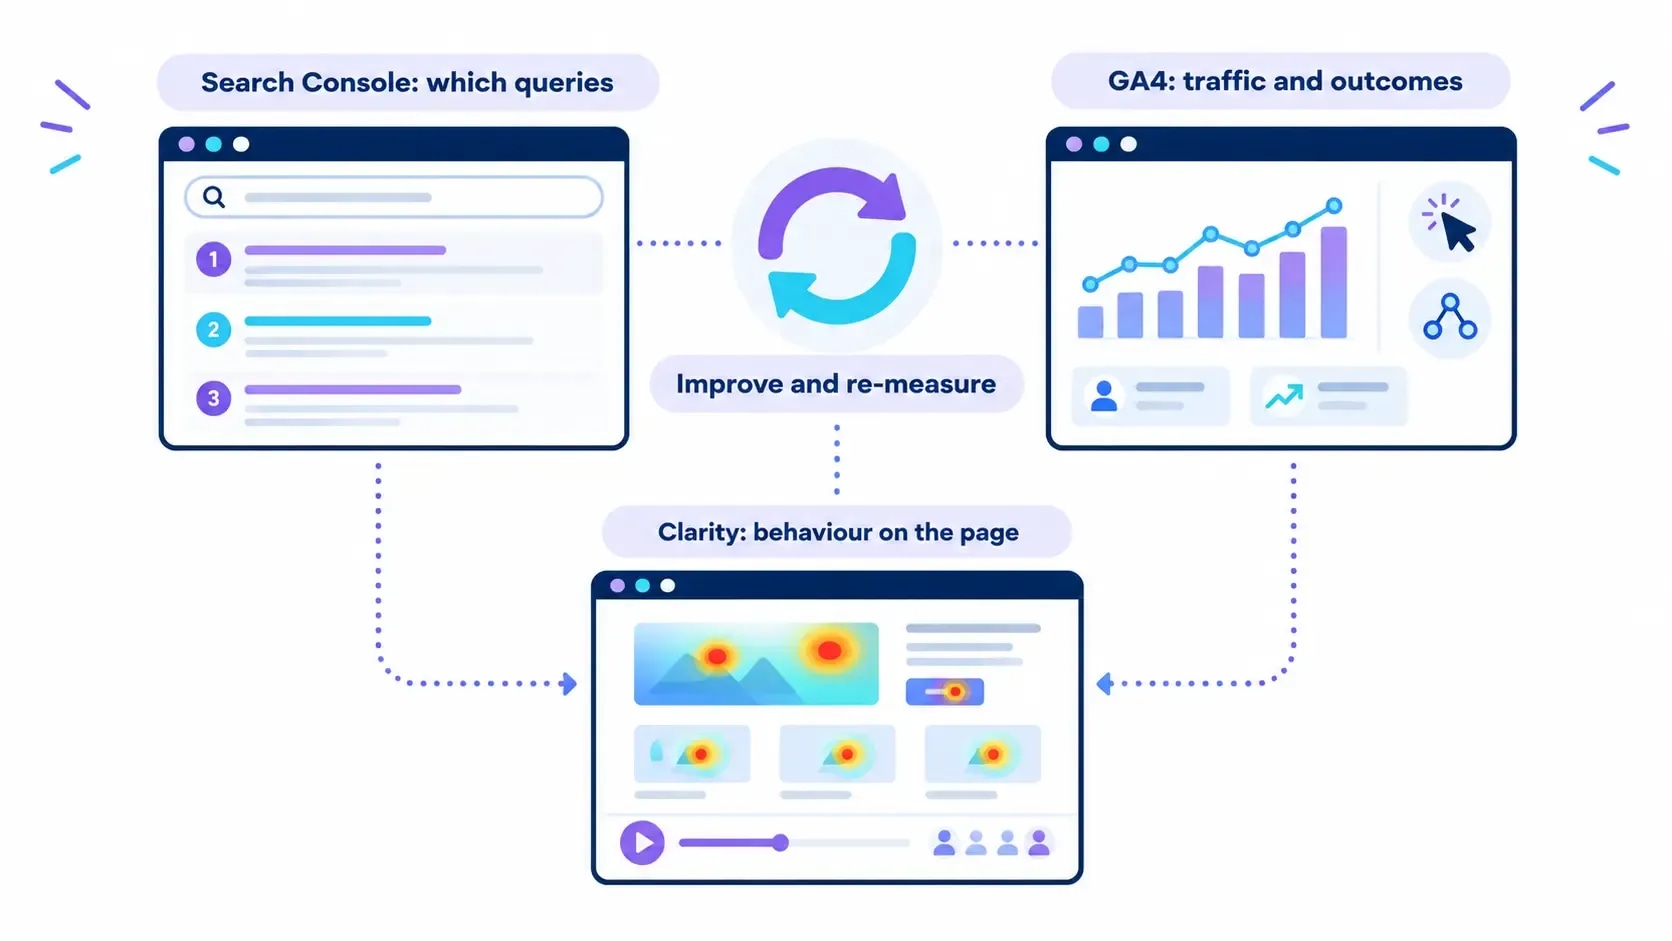
Clarity's GA integration pulls Google Analytics data into the Clarity dashboard, and each Clarity project can connect one GA web property [10]. The Google Analytics setup guide covers the GA4 side.
For SEO work, begin in Search Console. Find a landing page with meaningful impressions and a business reason to improve it, use GA4 to understand engagement and conversions, and then use Microsoft Clarity to see how visitors actually use the page. Clarity data is not a Google ranking factor. Its value is practical: it helps you improve the experience for people who already arrive.
A Microsoft Clarity workflow for SEO and CRO
1. Choose the page by impact
Start with a page that has traffic, a clear task and a measurable outcome: a high-traffic article, a product page, a landing page, a signup page or a checkout step.
2. Write one question
"Review the homepage" is too broad. "Why do mobile organic visitors leave before reaching the service comparison?" names a page, an audience and a behaviour.
3. Record a baseline
Before changing anything, note the date, the filters used, the relevant page metrics and the business outcome. Save the heatmap or recording links you are allowed to keep. Without a baseline, later movement is hard to read.
4. Look for the same problem twice
Look for the issue in at least two kinds of evidence. A click map may show dead clicks on a product image, while recordings show repeated taps followed by abandonment, and customer messages say people expected a zoom. Agreement does not prove cause, but it is a far stronger hypothesis than one unusual replay.
5. Make the smallest useful change
Fix a broken element directly. For uncertain design choices, change one meaningful thing or run an experiment. Do not redesign a whole page from one heatmap.
6. Measure the outcome
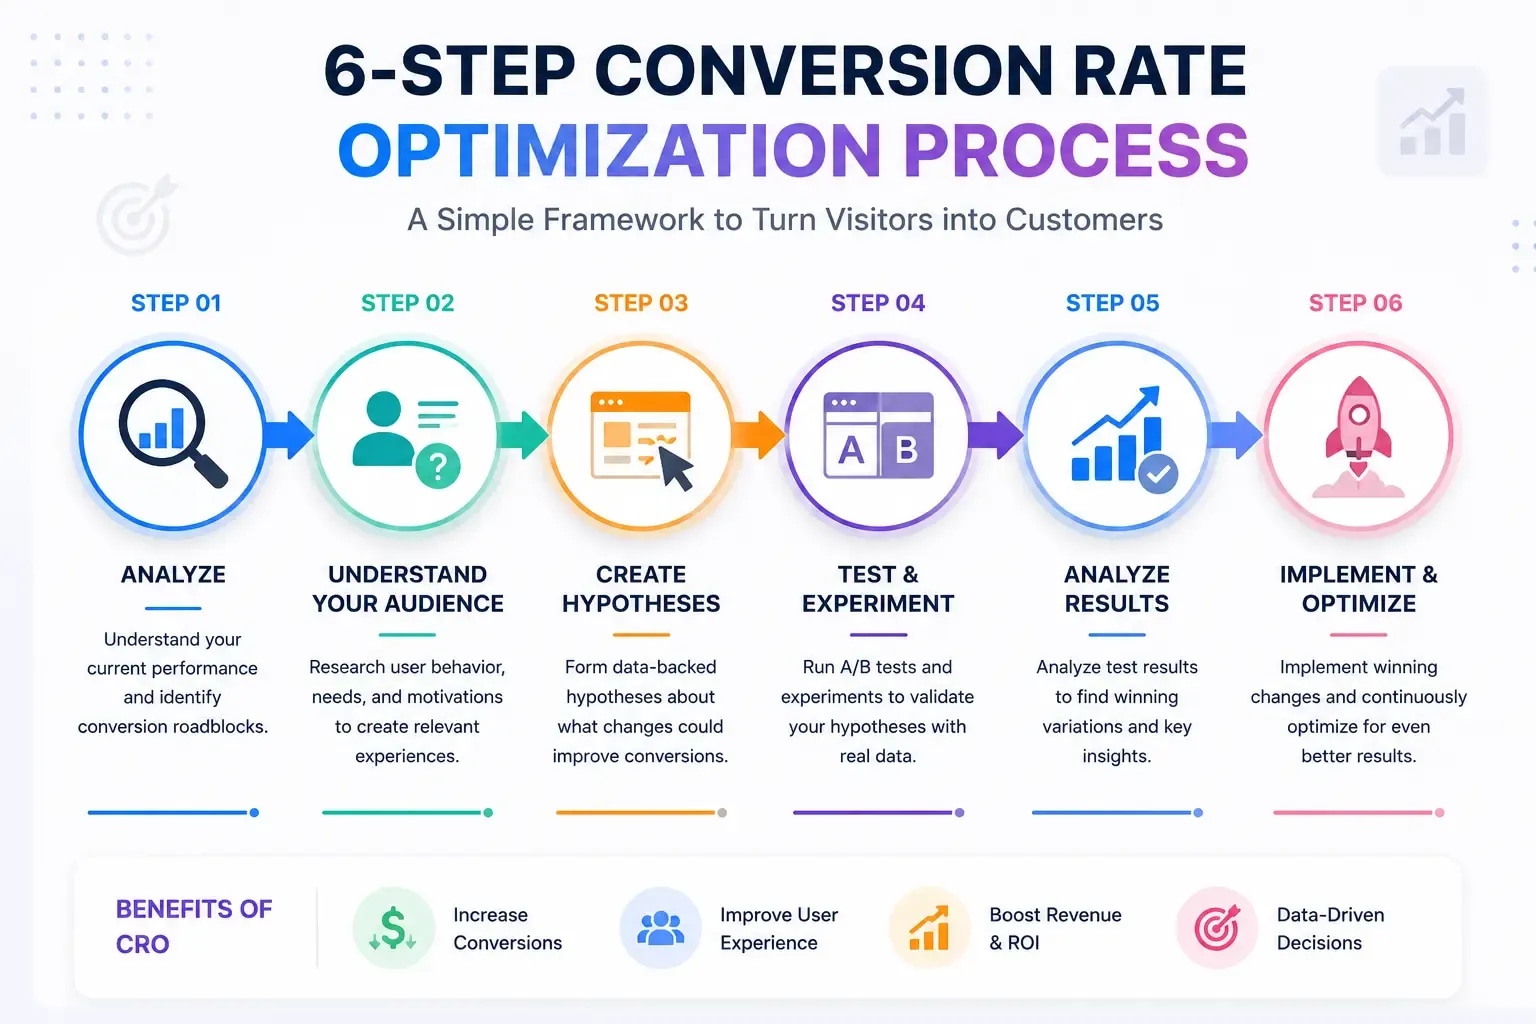
Check the metric tied to the original question: form completions, checkout progress, internal link clicks, qualified leads. Fewer rage clicks only matter if the page also works better for visitors and the business. The conversion rate optimization guide covers moving from observation to hypothesis, test and decision.
Common mistakes
- Watching random recordings. Random viewing overweights memorable behaviour. Filter from a question so every recording belongs to the same investigation.
- Treating a heatmap as a verdict. Heatmaps aggregate and lose context. Use them to locate a pattern, then check recordings and outcomes.
- Mixing devices. Desktop and mobile layouts produce different paths, folds and problems. Review them separately.
- Assuming Clarity explains "why". A recording shows a sequence. Your explanation is still an inference until feedback or a test confirms it.
- Skipping consent and masking checks. The defaults help, but the publisher is responsible. Test masking on the real sensitive templates.
- Reading bot requests as AI visibility. A crawl is not a citation, and a citation is not a ranking.
- Using old feature comparisons. Clarity changes often. Funnels, five heatmap types and AI Visibility are all missing from older reviews.
- Changing several things without a baseline. You will know performance moved, but not which change mattered.
Microsoft Clarity vs GA4 vs Hotjar
Clarity is the right tool when you need free heatmaps, recordings, filters, funnels and AI citation data. GA4 handles acquisition reporting, event measurement and conversion analysis. Most sites benefit from running both, so page behaviour can be read against traffic and outcomes.
Hotjar overlaps more directly with Clarity, since both are behavioural analytics tools. The right choice depends on pricing, recording limits, feedback tools, integrations and research depth, and those details change often. The Microsoft Clarity vs Hotjar comparison covers them in full.
A 30-minute Microsoft Clarity review
Daily dashboard browsing is rarely necessary. One focused session a week covers most sites:
| Minutes | Task |
|---|---|
| 5 | Check the one page and outcome chosen for this review |
| 5 | Open mobile and desktop heatmaps with the relevant segment |
| 10 | Watch recordings tied to the strongest anomaly |
| 5 | Write the observation, the evidence and a proposed explanation |
| 5 | Assign one action, owner, measurement and review date |
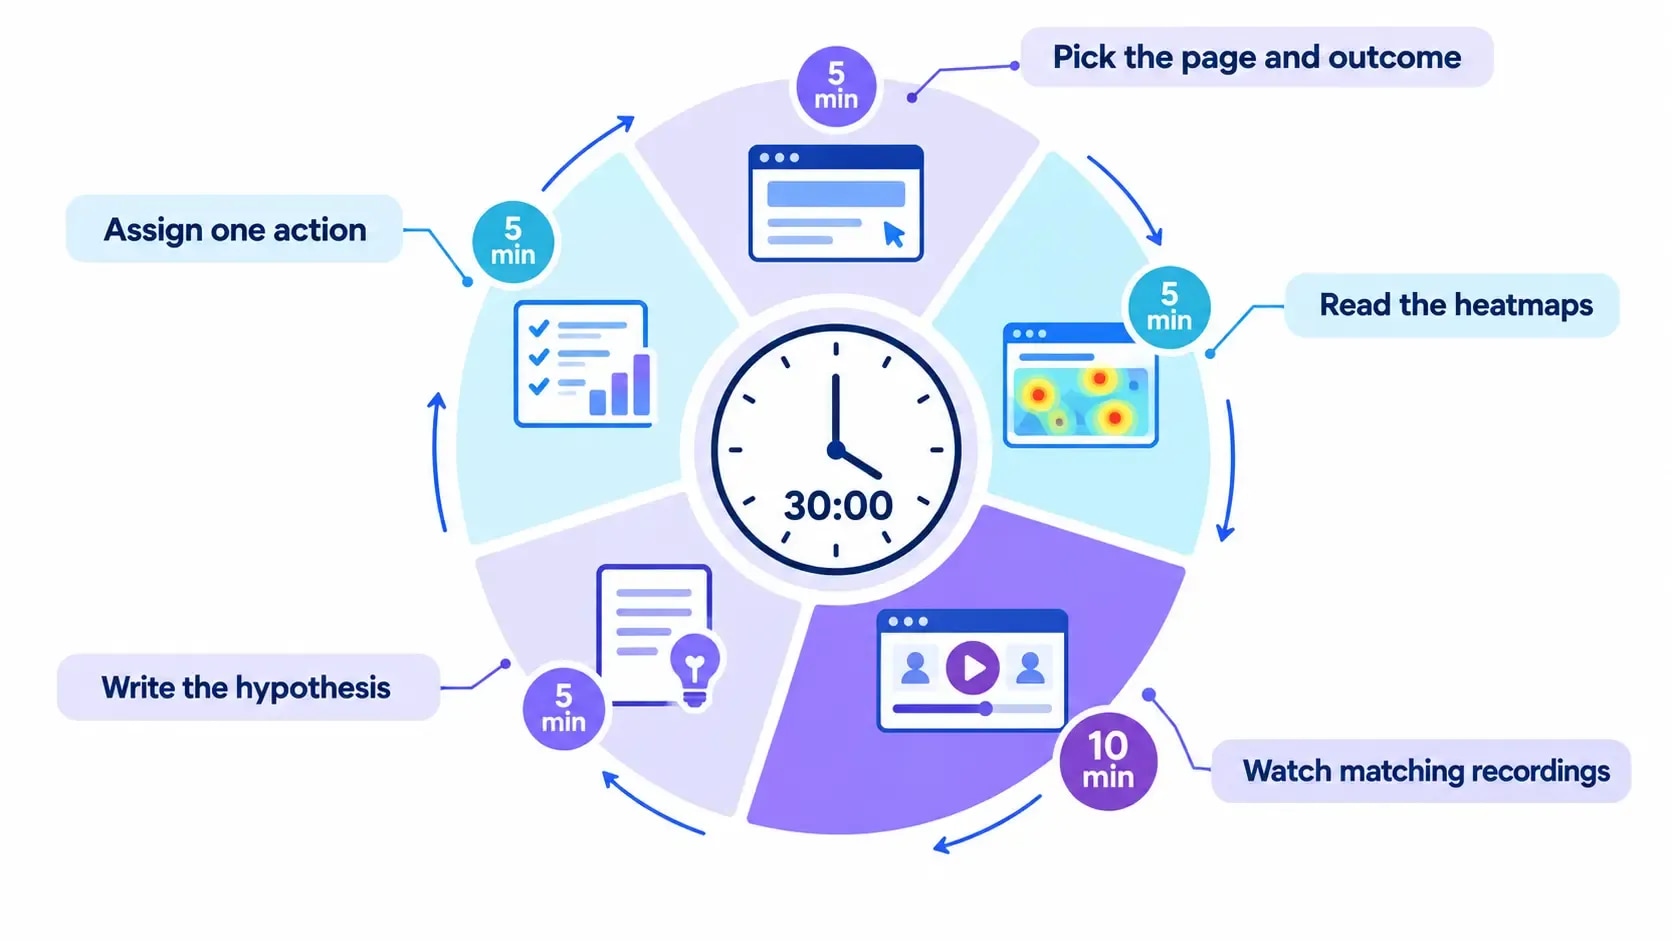
Keep an evidence log with columns for page, segment, observation, recording or heatmap link, hypothesis, change, baseline, outcome and decision. That turns Clarity from an interesting replay tool into part of a repeatable improvement process.
The bottom line
Microsoft Clarity is worth installing when your team has a real question about page behaviour and a way to measure what happens after a change. It costs nothing, and its feature set now reaches well beyond click and scroll maps, into funnels and AI citation data.
Interpretation is where the real work is. Separate what you observed from how you explain it, protect visitor data, and tie every change to a result. Install it correctly, pick one high-value page, and let evidence set the priority rather than the most dramatic recording.
Frequently Asked Questions
Is Microsoft Clarity really free?
Yes. Microsoft describes Clarity as free forever, with no traffic limits that force an upgrade and no paid version. Operational limits still apply: it records up to 100,000 sessions per project per day, and each heatmap covers up to 100,000 page views.
How long does Microsoft Clarity keep recordings?
Playback data is kept for 30 days. Labelled or favourited sessions and heatmap data are kept for 9 months. After that the data is deleted and cannot be recovered.
Does Microsoft Clarity replace Google Analytics 4?
No. Clarity is strongest at showing behaviour on a page. GA4 is better for acquisition, events, attribution and outcome measurement. Connecting the two gives you more useful context than either alone.
Is Microsoft Clarity GDPR compliant?
Microsoft states that Clarity is GDPR compliant as a data controller, and it provides consent and masking controls. Installing it does not make your website compliant automatically. You remain responsible for any required consent, configuration and applicable law.
What is Microsoft Clarity AI Visibility?
It is a set of dashboards showing how AI systems interact with your site. Citations shows which pages are cited in AI-generated answers, and Bot activity shows requests from AI crawlers based on server-side logs. Microsoft notes that bot requests do not mean content was cited, and citation data does not measure search rankings.
What should I analyse first in Microsoft Clarity?
Start with a high-value page that already has traffic and one clear question, such as why mobile visitors abandon a form. Filter to that page and device, inspect the heatmap, then watch recordings that match the pattern.
Sources and References
- Microsoft Learn, Clarity FAQ ↩
- Microsoft Learn, Clarity overview ↩
- Microsoft Learn, Set up Clarity ↩
- Microsoft Learn, Consent Mode ↩
- Microsoft Learn, Masking content ↩
- Microsoft Learn, Heatmaps overview ↩
- Microsoft Learn, Recordings overview ↩
- Microsoft Learn, Filters overview ↩
- Microsoft Learn, Funnels ↩
- Microsoft Learn, Google Analytics integration ↩
- Microsoft Learn, Data retention ↩
- Microsoft Learn, AI citations overview ↩
- Microsoft Learn, Bot activity overview ↩
Was this guide helpful?
Your answer helps Anobee improve future updates.

Written by
Bibek Thapa
AI-Powered Digital Growth Strategist
Bibek Thapa works across AI workflows, SEO, AI search optimization, content strategy, website growth, and productivity systems at Anobee.
- AI workflows
- Digital growth
- SEO
- GEO
- AEO
- Content strategy
- Website growth